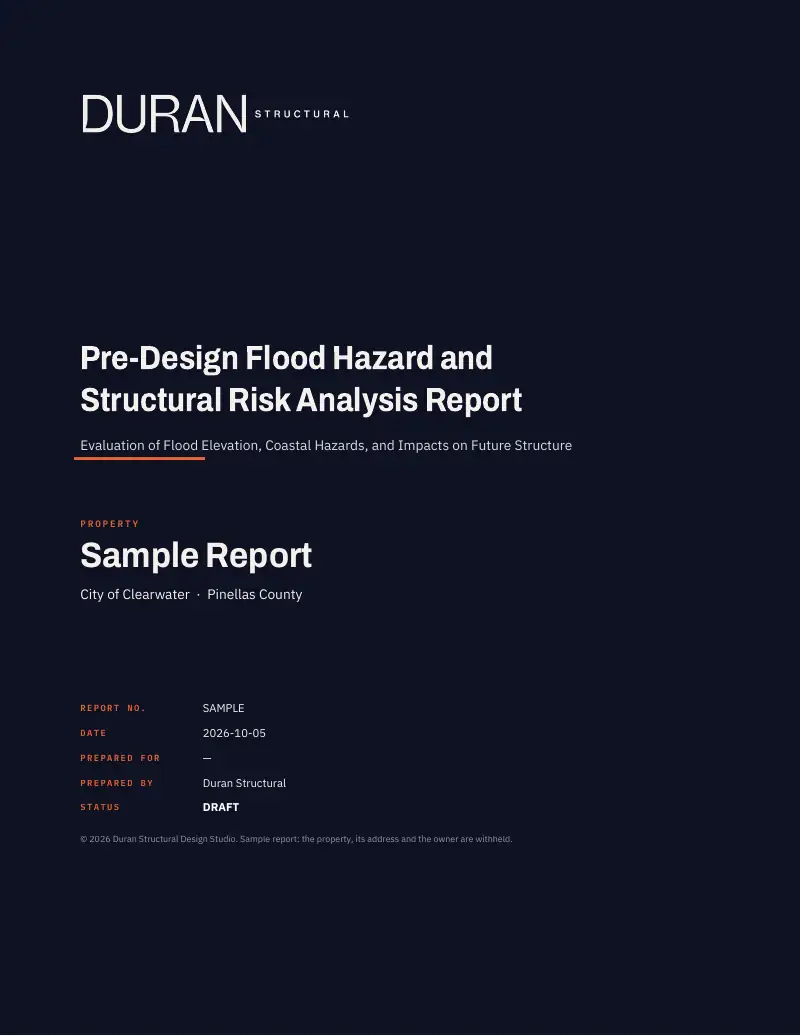
The flood elevation that actually governs your Florida coastal property, the foundation it forces, sea level rise, the Coastal Construction Control Line and every named storm since 2001. One report the owner, architect and engineer can all work from.
Every one of those storms put water against somebody's ground.
Your report starts with one address.
Every public flood record that touches it, pulled, dated and checked by a licensed engineer. Next: how high the water gets, and where the floor belongs.
2016
Hermine
Illustrative tracks of selected storms, 2016 to 2024. Not official NHC data.
2016Hermine
2016Matthew
2017Irma
2018Michael
2020Sally
2020Eta
2021Elsa
2022Ian
2022Nicole
2023Idalia
2024Debby
2024Helene
2024Milton
Your property
S-800.02The water
From the Sample Report
The FEMA map said 9.0 ft (it does not govern). The floor had to be 15.3.
On the sample lot, the local flood study governed, 6.3 ft above the FEMA number. Scroll and the water climbs through what it has done, what it could do, and where the code puts the floor.
6.7ft NAVD88
Site
Existing grade, lidar (preliminary until surveyed)
3.63ft NAVD88
Observed
Eta (2020), peak storm tide at the nearest tide gauge
7.62ft NAVD88
Observed
Helene (2024), peak storm tide at the nearest tide gauge
8.8ft NAVD88
Modeled
100-year still water, from the Flood Insurance Study
9.0ft NAVD88
Modeled
FEMA base flood elevation. Does not govern.
13.3ft NAVD88
Modeled
Local base flood elevation from the city's study. Governs.
1.23ft of rise
Projected
Expected sea level rise over the 50-year design life
13.6ft NAVD88
Modeled
500-year wave crest with sea level rise
15.3ft NAVD88
Design
Required lowest floor, to the bottom of the lowest horizontal member
Elevation scale, 0 to 18 ft NAVD88.
ObservedModeledSea level riseDesign
The sample lot
A barrier island lot on Florida's Gulf coast.
Ground at about 6.7 ft NAVD88 by lidar, 146 ft landward of the Coastal Construction Control Line. FEMA zone AE, evacuation Zone A, and a Category 1 storm surge zone: even the weakest hurricane can put water on it.
Observed: Eta, 2020
Most storms stay on the beach.
Tropical Storm Eta passed 37 miles away and left 3.63 ft at the nearest tide gauge. Of the 23 named storms within 110 miles since 2001, 22 left the gauge under 5 ft.
Observed: Helene, 2024
Then Helene.
A Category 4 that never came closer than 100 miles pushed 7.23 ft of surge to the gauge: a 7.62 ft storm tide, right at or above this lot's ground. Only a survey can say which.
Modeled: 100-year flood
The 100-year flood: 8.8 ft, with waves on top.
A 1% chance every year, about 26% over a 30-year mortgage. Still water is what maps and insurance quote. On a coastal lot, the wave crest is what reaches the floor framing.
Modeled: FEMA flood map
FEMA's map says 9.0 ft.
The flood map puts the base flood elevation at 9.0 ft. It's the number everyone quotes, and plenty of pro formas stop right here. On this lot, it doesn't govern.
Modeled: local flood study
The city's study says 13.3.
The city's own flood study puts the 1% flood 4.3 ft above FEMA's. Add 2 ft of freeboard and the design flood elevation is 15.3 ft: 6.3 ft above the FEMA number. That gap is stairs, piles, height limit and budget.
Projected: sea level rise
Then add the sea.
The nearest long-record tide gauge has climbed 4.37 mm a year for half a century. Over a 50-year design life the expected regional rise is 1.23 ft, and 2.68 ft in the high scenario. Today's code leaves it out; the next flood standard puts it in.
Modeled: 500-year flood
Even the 500-year flood stays under it.
Still water 12.1 ft. With waves and 1.23 ft of sea level rise, the crest reaches 13.6 ft, 1.7 ft under the floor. ASCE 24-24 wouldn't raise it.
Design: required floor
Build at 15.3 ft, or higher.
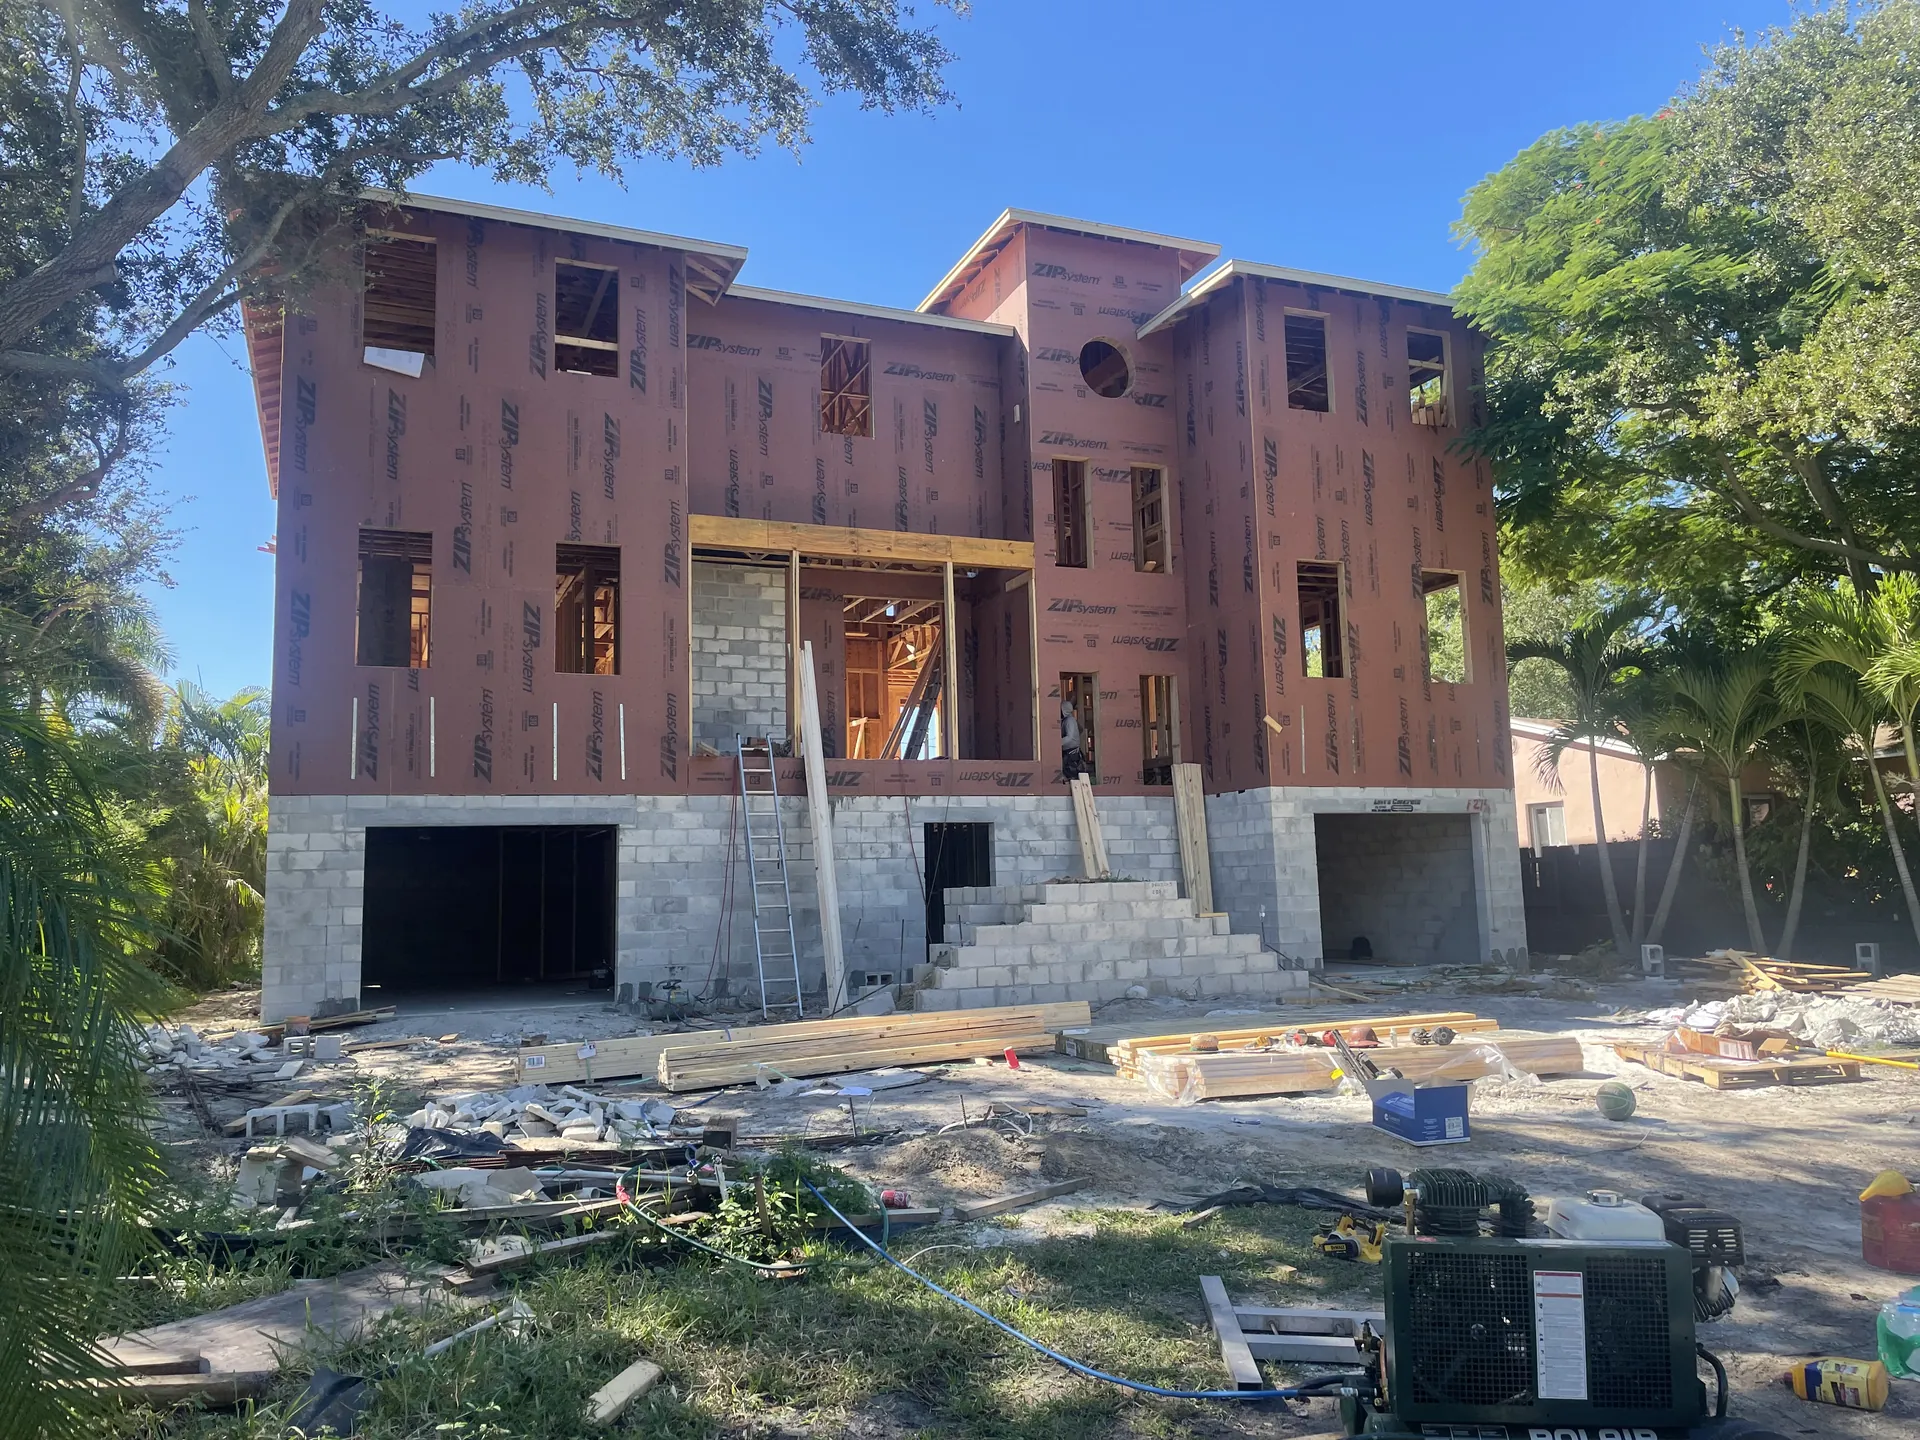
Measured to the bottom of the lowest horizontal structural member, on deep piles, with breakaway walls below. The report lays out three floors, 15.3, 16.3 recommended and 17.3, with what each one buys and costs.
That's one lot. Yours has its own numbers.
Different maps, different local studies, different storms. The report finds them for your parcel, so the whole team starts design from the same verified numbers.
23 named storms within 110 miles of the sample lot since 2001
Category doesn't tell you the water. The track does.
Milton came within 42 miles as a Category 3 and left 2.25 ft at the nearest tide gauge. Helene never came closer than 100 miles and left 7.62 ft. With the lot on the right side of a storm's track, the wind drives water ashore. On the left side, it pulls water out of the bay.
Lot on the storm's right side
Left side
Lot grade
Peak storm tide in ft NAVD88 at the nearest NOAA tide gauge: a regional reading, not the water level at the property. Tracks from NHC HURDAT2. Bonnie (2010): the gauge lost data, so its values are minimums. Select a storm for details; on a phone, swipe the chart sideways.
S-800.04CCCL and sea level
Coastal Construction Control Line and sea level rise
Where the state draws the line, and where the sea is heading.
Two things a flood map won't show you. The report places the lot against Florida's Coastal Construction Control Line and reads the county coastal zone it falls in. Then it projects the local sea over the life of the building.
The CCCL sets the rules
Seaward of the line, construction needs a state permit and the state's 100-year storm elevation applies. Landward, the county coastal code takes over and its zone decides what must stand on piles and what may go below the floor.
Zone 1Seaward of the CCCL. No habitable buildings under the county code.
Zone 2Landward to the farthest of 300 ft, a state or county road, or the limit of the V or Coastal A zone. Elevated on piles, breakaway below.
Zone 3The rest of the coastal building zone.
Sample lot: 146 ft landward of the CCCL, in Zone 2. The state's 100-year storm elevation (15.9 ft) applies only seaward of the line, so the local 15.3 ft governs.
The sea keeps rising
Rise over the sample's 50-year design life, from the regional projections and the nearest long-record tide gauge: 4.37 mm a year over 52.6 years.
Historic gauge trend0.72 ft
NOAA Intermediate Lowexpected1.23 ft
NOAA Intermediate1.80 ft
NOAA Intermediate High2.68 ft
10.0
ft NAVD88: the sample's 100-year still water of 8.8 ft, plus the expected 1.23 ft of rise.
Not in today's code requirement. ASCE 24-24, the next flood standard, adds sea level change to the design elevation; the report shows what it would change.
S-800.05Where the numbers come from
Twenty sources. One parcel. One report.
Before coastal design starts, someone on the team has to pull each of these for the parcel, put them on one vertical datum, check them against each other and note the date. It's careful, slow work on every project. The report does it once and cites every value, so the architect and engineer start from numbers that are already verified.
Federal
FEMA flood mapZone, base flood elevation, panel, LiMWA
FEMA Flood Insurance StudyStill water by return period, transects
Coastal Construction Control LineFDEP: where the lot sits against the line
State 100-year storm elevationFDEP: applies seaward of the CCCL
Florida Building CodeFlood and coastal provisions
Evacuation zonesFDEM Know Your Zone
Storm surge zonesRegional SLOSH study, by category
Sea level projectionsRegional scenarios, 50-year design life
County and city
County coastal construction codeCoastal zones, what goes below the floor
Local flood portalLocal base and design flood elevations
Code of ordinancesFreeboard and local amendments
S-800.06Odds
A 100-year flood is not once a century.
It's a 1% chance every year, and the years add up. Pick a flood and how long you'll own the property.
26%
chance of at least one 100-year flood in 30 years
At the sample lot, the 100-year still water is 8.8 ft NAVD88, 2.1 ft above the ground.
Each square is 1%.
Still water from the FEMA Flood Insurance Study at the sample lot. Still water includes wave setup but not wave height, so it is not a build-to elevation.
S-800.07Sample report
Sample Report, all 23 pages
Plain answers up front. Engineering in the back.
Sections 01 to 09 tell the owner what the site requires in plain terms. The appendices give the contractor a line-by-line pricing checklist and the engineer of record the coastal flood loads to design from. Every value carries its source and retrieval date. The property is withheld.
Select a section, use the arrows, or select the page to enlarge it.
01 / 23
Get the Sample Report (PDF)
All 23 pages, 1 MB. The property, its address and the owner are withheld. We email it to you with the engagement letter.
S-800.08 / what it settles
What it settles before design starts
Six questions every coastal project has to answer. The report answers them on day one, with the sample lot's answers shown.
Sample Report, page 1 of 23. The property, its address and the owner are withheld.
Which flood elevation governs?
FEMA's map, the local study or the state's coastal line. The report compares them and names the one that controls.
Sample: the local study, base flood 13.3 ft. Lowest floor 15.3 ft NAVD88.
What foundation does it force?
Coastal zones can rule out spread footings and slabs before anyone sizes a beam.
Sample: deep piles required. Spread footings not permitted; mat by variance only.
What can go below the floor?
Parking, storage and access, built to break away and be replaced after a flood. A recurring cost, not a one-time one.
Sample: breakaway walls, frangible slab, flood openings, all MEP above 15.3 ft.
How high has the water come?
Every named storm within 110 miles since 2001, read at the nearest NOAA tide gauge.
Sample: 23 storms. Highest: Helene 2024, 7.62 ft at the gauge.
What will the water do to the piles?
Hydrostatic, hydrodynamic, breaking-wave, debris and buoyancy loads, plus erosion and local scour.
Sample: breaking wave 3,629 lb per pile; local scour 2.8 ft at a single column.
Will the next code change it?
A side-by-side with ASCE 24-24 and sea level rise over a 50-year design life.
Sample: ASCE 24-24 sets 13.6 ft here; the local 15.3 ft still governs.
One report, read by the whole team
Residential developers
The governing floor, the foundation it forces and the recurring costs under the house, while the lot is still a decision.
Architects
Flood criteria and a fixed floor elevation from day one, so stairs, elevator, height limit and MEP are planned around the right number.
Structural and geotechnical engineers
Design still water, velocity, wave height, flood loads, eroded grade and scour, each with its source and date.
Contractors
A line-by-line checklist to price: piles, breakaway walls, flood openings, corrosion-resistant hardware, impact-rated openings.
Owners and buyers
What the FEMA number leaves out, the insurance quote to get at each floor height, and the 50% rule that brings later remodels up to code.
How it works
S-800.09 / how it works
Federal, state, county and city flood data, pulled for one parcel and checked by a licensed engineer.
01
Send the address
Choose a report and tell us about the property and what you're planning.
02
We build the record
Every public flood record that touches the parcel is pulled, put on one datum and dated, and a licensed engineer reviews every finding.
03
You get the report
A PDF in 4 business days, with a short list of what to settle before design starts.
S-800.10Pricing
Two reports. One address each.
Order before you close on a lot, or before schematic design starts. Either way, the floor is set before anything else is. A report is a pre-design analysis from public data, not a design: the engineer of record sets final values. A surveyed elevation certificate and geotechnical borings are separate engagements.
Owner report
$2,500per address
For owners and buyers deciding whether, and how, to build.
Owner and design team report
$7,500per address
For owners working with an architect and structural engineer who will design from it.
Flood zone, base flood elevation, map panel, and pending map changes
yes
yes
Required and recommended floor elevation, explained in plain language
yes
yes
Every named storm within 110 miles since 2001, with peak water against your ground
yes
yes
Sea level rise over the life of the building
yes
yes
Coastal construction zone, CCCL position, and shoreline trend
yes
yes
A before-you-build checklist and a scope table for contractor pricing
yes
yes
FIS coastal transect data and stillwater elevations by recurrence interval
no
yes
Governing elevation analysis: code minimum against the ASCE 24 performance target
no
yes
Eroded grade and local scour for foundation embedment
Duran Structural, a structural engineering firm in Tampa that works on new coastal buildings, forensic investigations and post-disaster assessments. A licensed professional engineer reviews every finding, and issued reports carry the engineer's seal.
No. It's a pre-design analysis. Pile type, embedment, and the structural design are a separate engagement with the engineer of record.
No. It tells you which ones you need and what they have to confirm. Ground elevations in the report are screening values until a surveyor sets them.
Because it often isn't the number that governs. A local flood study, freeboard, the state's coastal line and the county coastal code can each set a higher floor. On the sample lot, the required floor was 6.3 ft above the FEMA number.
The report records the map in force on its date and flags any revision FEMA has pending. When a new map takes effect, have the report re-run before you pull a permit.
Florida coastal properties. Send the address and we'll confirm coverage before you commit.
4 business days from the order and the property details.
Yes. The design team report is written for them, with the source, date, and confidence level of every value.
Related work.
S-800.13 / related
A report is a pre-design analysis. The work that follows it is a separate engagement.
Choose a report and tell us about the property and what you're planning. One address per report. A licensed engineer confirms coverage before you commit.
Engineer of record
Judian Duran, PEPrincipal Structural Engineer
Licensure
PE in 9 states + DCFL / GA / NC / AL / TN / VA / MD / NV / NY / DC